If you work in flexible packaging, you’ve probably seen dozens of test reports from a water vapor permeability tester for plastic films. Most people glance at the final “pass” mark, file the paper away, and move on. That’s a missed opportunity. Buried in those numbers are early warnings about material consistency, process shifts, and even whether the film will actually protect your product on a warm, humid shelf.
This article walks through the five pieces of information that matter most—and shows you, with real examples, why each one deserves a second look.
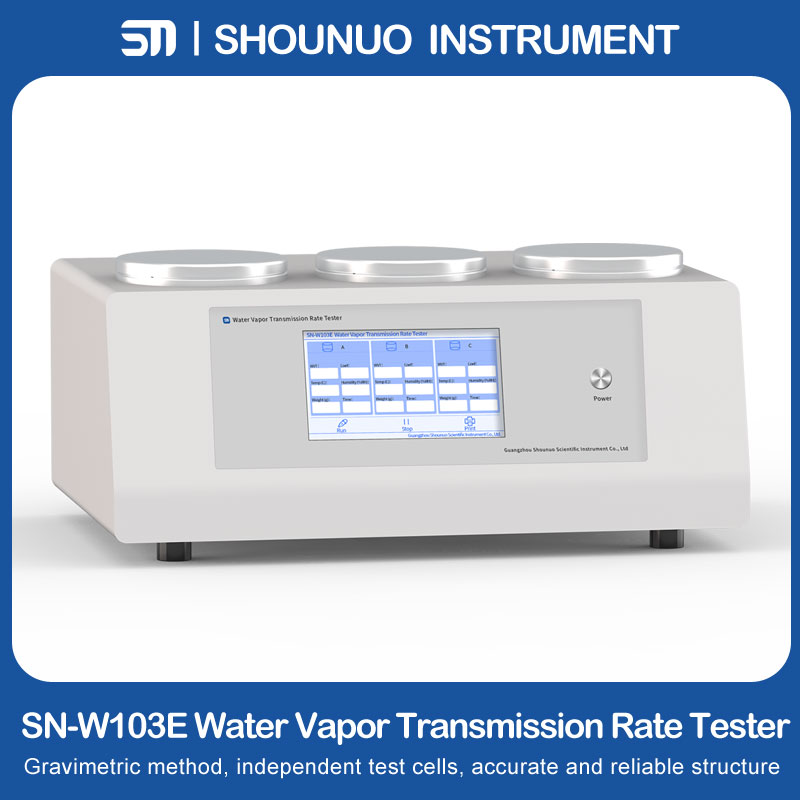
The first figure on the report is usually the water vapor transmission rate (WVTR), given in grams per square metre per 24 hours [g/(m²·24h)]. It tells you how much moisture crosses the film under the stated conditions. The lower the WVTR, the better the barrier.
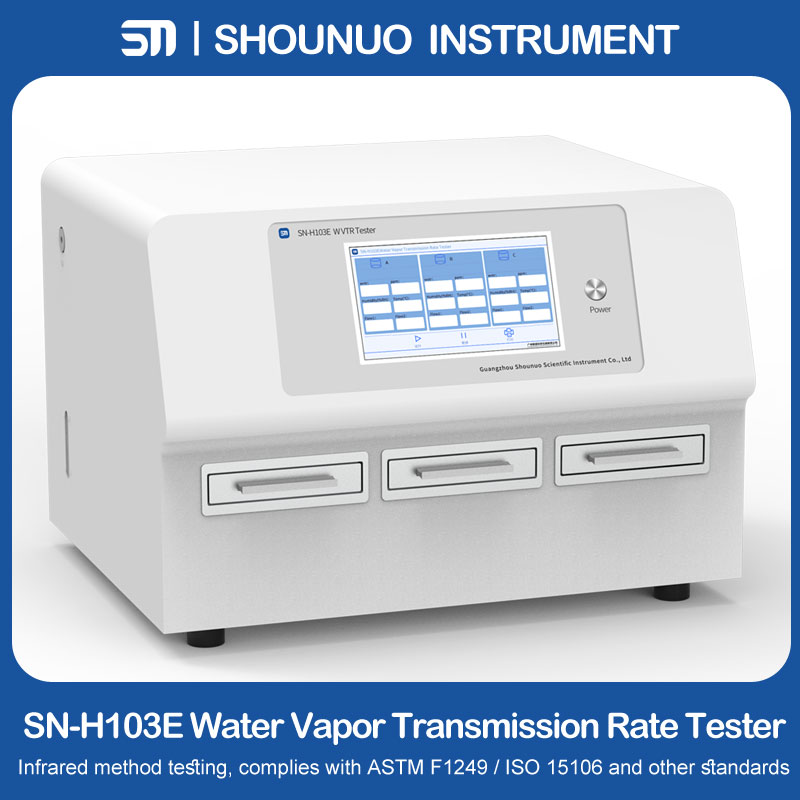
Sometimes, though, you’ll also see a water vapor permeability coefficient (WVP). This one accounts for thickness, so it reflects the material’s intrinsic barrier property, not the finished film’s performance. If you’re comparing, say, a 12‑micron PET with a 25‑micron PE—different thicknesses, different structures—WVP gives you a fairer basis for material selection. For routine quality control, WVTR is usually your primary target; for R&D or supplier benchmarking, pay attention to WVP as well.
A WVTR value is only as useful as the environment in which it was measured. Every credible report must state:
A real‑world example: A biscuit maker tested a metallised PET film at 23 °C / 50 % RH and got 5.2 g/(m²·24h). It passed their internal spec. But that spec had been written for 38 °C / 90 % RH—the actual storage conditions in a tropical warehouse. At that higher temperature and humidity, the same film measured 12.8 g/(m²·24h), well above the limit. The biscuits went soft in two months instead of twelve. The lesson is simple: always match the test conditions to your real‑world scenario, or at least to the reference standard you’re working against.
A single test result is rarely enough. Standard practice requires at least three to five specimens per sample. The report should give you:
If the CV exceeds about 5 %, the data are too scattered to trust the average alone. That scatter often points to non‑uniform film—maybe uneven coating, poor mixing, or edge effects.
Consider a lamination plant that produced two batches of a composite film. Both had mean WVTRs of 1.8 and 2.1 g/(m²·24h)—both within specification. But the first batch had an SD of 0.12, while the second had 0.58. A closer look showed that the second batch included samples ranging from 1.6 to 2.9. That wide spread traced back to uneven adhesive application in the laminator. If the quality team had only checked the average, they would have released the batch—and eventually faced complaints from customers whose products failed prematurely. The standard deviation, often ignored, is one of the earliest signs of process drift.
If your tester uses an infrared or electrolytic sensor, the report may include a cumulative figure for the total water vapour that passed through the film during the test. This number is useful for one specific check: if the total permeated mass is less than about 20 % of the total vapour introduced into the cell, the sensor is spending most of its time reading background noise rather than true permeation. In that situation, the reported WVTR is questionable. Many operators skip this note, but it’s worth a quick glance—if you see that warning, reseal the specimen and run the test again.
This is perhaps the most common misunderstanding. A film can easily meet its WVTR specification and still be the wrong choice for your application—because moisture is not the only threat, and because the specification may not reflect your actual shelf life requirements.
Take two popular structures: one is BOPP/metallised/PE, the other is PET/aluminium foil/PE. Both had WVTR values around 2.0 g/(m²·24h) and both passed their respective specs. They were used to package roasted coffee beans, which need a 12‑month flavour life. The metallised structure allowed significant aroma loss after only six months, while the foil structure kept the coffee fresh for the full year. The WVTR reports were identical, but the oxygen transmission rates were orders of magnitude apart—and that difference wasn’t captured by the water vapour test. So a passing WVTR result should never be taken as a complete guarantee. Always consider the whole barrier profile—oxygen, light, and organic vapours—and compare the reported data against your product’s specific storage environment.
Next time you receive a test report from a water vapor permeability tester for plastic films, take five minutes to work through this short checklist:
Reading these reports carefully won’t just help you catch non‑conforming batches—it will also give you a window into your supplier’s process stability and your own packaging’s true capability. And that knowledge, in the end, is what keeps your products safe and your customers satisfied.
Previous article:GC-05E Gas Chromatograph - Solvent Residue Detector for Printing
Next article:Leak vs Seal Tester: Key Differences & Selection Guide
Back
Packaging Solvent Tester – Detect Odors Before They Reach Your Client
07.09.2026
Package Leak Tester: Stop Costly Leaks Before They Happen
31.08.2026
Food Packaging Water Vapor Transmission Rate Tester
24.08.2026
Positive Pressure Seal Tester for Leak and Seal Strength Testing | ASTM F1140 & ISO 11607 Compliant
17.08.2026Scan
Add WhatsApp
Email
info@snlabtester.com
Business Inquiry
+86 13316049470
Free Hotline
+86 020-26221916